

 Today we present to our beloved stats addicts a new way to perceive numbers: stats tables! Tabular data is arranged in convenient grids so you can easily compare values along two dimensions: columns and rows. Headings along the top and left edges provide context and orientation. Alternating rows are faintly shaded to improve readability. Surely you have seen these things before.
Three new tables are available today: Months and Years, Average per Day, and Recent Weeks. They were modeled after tables Matt created for displaying top-secret WordPress.com metrics. Each one resembles a calendar in its own way. You probably won’t want to refresh these as often as some other stats pages—only a few of the table cells will be updated—but I won’t try to stop you. I know what it’s like.
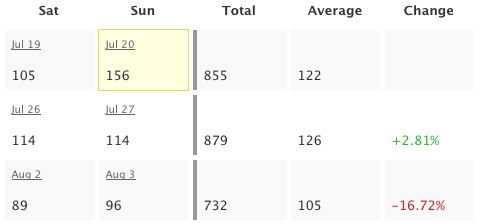 Business folks and aesthetes alike will revel. The math-minded among you can throw away your calculators: the tables already include useful sums and averages, the results of arcane formulas you’d rather forget anyway. And put away your crayons, artistic types: colorful numbers illustrate percent change for recent weeks and a yellow box highlights the greatest value in each table. The other Matt helped with the colors, despite his colorblindness.
I know how some people cling to their calculators and crayons. If you are compelled to verify my computations, please first read the math notes below the tables. They should explain why the numbers don’t always add up. I hope you find the logic logical.
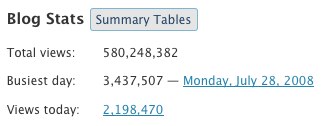 Ah, but how do you get there? The new Summary Tables button reveals tables for the whole blog. Tables for each post are shown on the same page as individual post charts, so just click the little
 ![]() icon to see those. The new tables are available to WordPress.com bloggers as well as bloggers using the WordPress.com Stats plugin (no upgrade required). Please enjoy responsibly.
icon to see those. The new tables are available to WordPress.com bloggers as well as bloggers using the WordPress.com Stats plugin (no upgrade required). Please enjoy responsibly.
Note to 1992: I almost put “Totally” in the title. It was not easy to resist.

that is quite good, thanks
Awe! So cool…another way of viewing things….very
Nice…..
aloha!
Hey Andy,
This is Superb.:) No wonder I love wordpress so much.;)
Stats is one of the coolest features of WP… And now it has got better… Thanks!!!
*bow*
Excellent job
We’re all stats addicts here, and will bow to you every time there is an update to the stats views. The day you pass Google Analytics in most stats functions I will start donating to you.
Thank You. These make it easier.
Its seems nice.
I’ll try it.
Thanks…..
wow now im happy to have a Wap site
A huge thanks, what a nice supprise. You go guys…..
More data. Give me more data, muhahahaaaa
@ intlxpatr
“You write your heart out for one or two kindred souls and get barely a ripple, you dash off a couple lines and it is an all-time high stat producer.”
Yep, that baffles the hell out of me, too!
Thanks, guys, great idea.
That’s awesome! I’ve been wondering about my averages, and now I know!
Very Nice , Thank you WP group.
Fabulous. This is just the sort of stuff I love. Thank you very much!
It’s nice to know you are anticipating our needs effectively.
Excellent!
I was quite happy and surprised when I saw the summary table button. =)
awesome, now i can see how many are not coming to my site anymore hehe 🙂
I like it!
Wow this will definitely help me in building my reviews blog. Thanks WordPress! 😀
thanks..
Thanks
Super cool. Luv it.
Wow, excellent. It’s make me easy to see how my visitor increased or decreased. Rocks !!
Thanks WordPress for ever better features! I have been keeping stats like this on my own in Excel for a few months now, but I guess now there’s no need for that. Thank you. I am looking forward to using this great new feature.
this is really amazing. i hope you’ll not getting tired working to improve our WP experience.
thanks!
Cool Thanks !
thx a lot :)))))))))
Just the perfect stats for a stat addict like me.
Hope we also get more features like ………….
count on the number of times the blog has been reached through a particular keyword …
huh !!!!!
This is a terrific extension of the stats breakdowns that Stat Counter has been offering for some time … with the Word Press stats, however, one can see trends and work their traffic accordingly. For example, my traffic peaked in March, which compelled me to go back to the postings for March and see what exactly was working well back then, what was drawing in new readers and bringing back repeat visitors. An excellent tool for the serious blogger.
Brilliant, good job!
Only one word: Thanks
Hi Andy,
I’m posting to say that I’ve been here for the whole time that you have been working on the stats program and I want to compliment you on the work you have done. The new Summary Tables button that reveal tables for the whole blog are really useful. Thanks for the improvement. 🙂
Awesome update WP is getting better 🙂
awesome
it’ really incredible!
Hi Andy,
How come you can read people’s minds that good? Tell me your secret. I won’t tell anybody.
Thank you for fulfilling one of my dreams.
Happy day to all WP-addicts !
Thanks, I’m a Stat junkie.
I love it soooo much!!
nice, thanks 😀
nice
loved it! keep going
Thank you.
Thanks. It’s a easy way to understand abou stats..
Very good. Thanks
Nice! Very Nice! Thanks!
great job!
Yes, great addition, still I like the graphical stats
Thanks
Makes you see your stuff’s actually been read.
Question: Is it possible to see where people are based who read a post?
i love it!!!!!!
YOU ROCK!!!
That’s a good CEO Page to view
Awesome! It´s very useful
Great notice!!
Thanks ! 🙂
that’s really nice! 🙂
Stats are always nice. well done !
This is really super cool.. plus the % change is rewarding too..
Thank You for doing this.
This is so cool!! I enjoy the stats.
Splendid! Keep it up WP, amaze us more! XD
thx..very intersting stat to look at 🙂
wow..its a new cool features for wp stats
love it.. really nice
Thanks Andy its really cool….
I saw in my dream last night that I’m surfing the web and accidentally open this weblog and see you’ve posted an article with this title : Edit your blog’s HTML for free ! 🙂
Cool stuff… It will be useful for us…
Nice!
Great!
But… why don’t you put the button “Summary tables” closer to the swf stats graphics? 😕
Starting from day one, i loved the features of wordpress and now i guess i’ll be continuing to love it much more with the never ending feature edition. Bravo wordpress team, keep up the good work 🙂 .
WP is the best … Great !!
Fantastic!
Hi,
Looks great!
I really like it. Very helpful info.
I missed the instruction in my 1st read thru about clicking on the “Doohickey” icon. LOL
If you hid it I mighta found it sooner.
Keep up the good work!
Ed
Really a beautiful work!
Cool!!! This will allow me to determine which days do write in order to get more traffic. Thanks
Cool tool. Thanks. Keep adding the good stuff…
Nice. What about do not truncate the search engine terms??
Very nice feature. Thanks.
Nice, will be passing this along. Thank you.
nice feature. will try it
hi.. very nice…
very nice info
Great job guys, thanx for this, ill have a look !
That is why I love this country.
cheers!
Looking good! A little hard to read sometimes when packed with data, but a welcome addition. Thanks.
Cool! thanks
I saw it before I came to this post. And I was so glad. Neat job. Thx
LOVE IT! I was just wondering to myself : “I wonder what my average per day is…?” And then, “Oh, wait, what is this?”
Thanks, guys!
This is really very nice. Thank you!
Nice
Arrgh! I can’t stop looking at these. So cool! Thanks WP!!
love wordpress 😉
andy,
are you aware that your picture is very creepy looking?
🙂 im just kidding – i wanted to tell you that i think all of this ‘behind the scenes’ stuff with wordpress is very interesting, and im appreciative
kbye.
Awesome and very useful feaaaaaaturess. Heavy Thanks.
that’s pretty cool.
always good to be ahead of the curve!
nice feature!
cool.
nice!
Wow, great. It gives the best way to see our viewers. Keep presenting the best for all.
Hey, this is awesome!! Any plans for a ClustrMaps sorta thing?! So we know where people are looking from 😀