Advanced Woocommerce Reporting and Insights – Smart Product Sales Reporting
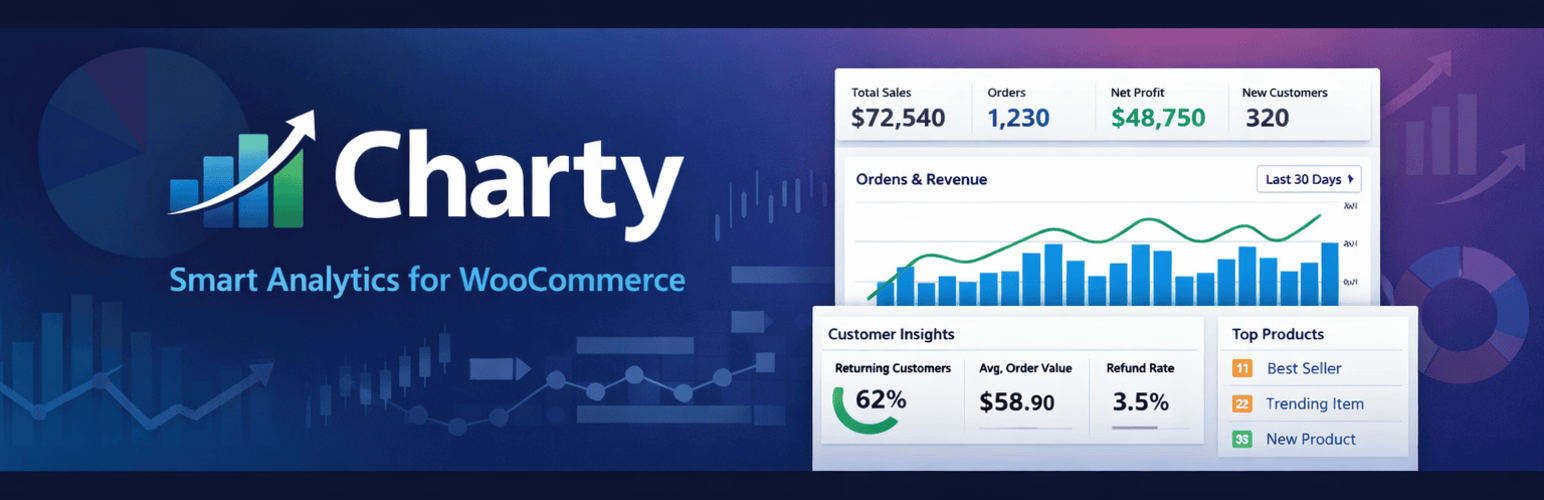
Charty Analytics is a powerful custom WooCommerce analytics and reporting plugin designed to replace outdated WooCommerce reports with a clean, fast, and insight-driven dashboard.
It helps store owners, marketers, and agencies understand sales performance, customer behavior, product trends, marketing impact, and financial health — all in one place.
Unlike default WooCommerce analytics, Charty focuses on clarity, speed, and actionable insights, not just raw numbers.
Key Features
** Modern Dashboard Interface** – Clean and responsive UI – Sidebar-based navigation – Designed for fast decision-making
** Smart Date Range Selector** – Last 24h – Last 2 days – Last 7 days – Last 30 days – Last 90 days – This month – Last month – This year
✔ High-Performance Charts – Powered by Apache ECharts – Lightweight and fast rendering – Smooth interactive charts – No external tracking scripts
Orders Analytics
Get deep insights into your WooCommerce orders and revenue flow.
- Orders by status
- Top payment methods
- Top shipping methods
- Average Order Value (AOV)
- Refund rate analysis
- Net vs gross sales
- Order size distribution
- Coupon usage impact
- Orders by hour
- Orders by weekday
- Latest orders list with average fulfillment time
Perfect for understanding buying patterns and identifying revenue bottlenecks.
Product Insights
Understand which products drive your business and which need attention.
- Top products by revenue
- Top products by quantity sold
- Top products by profit
- Refunds by product
- Rising products
- Dropping products
- Coupon dependency
- New vs returning revenue
- Inventory risk indicators
- Cross-sell product pairs
- Low stock alerts
Ideal for inventory planning and pricing optimization.
Customer Analytics
Track customer behavior and retention with advanced analytics.
- New vs returning customers
- Repeat purchase rate
- Average order value (AOV)
- Customer lifetime value (LTV)
- RFM segmentation
- Revenue by country
- Days to second purchase
- Spend vs number of orders
- Churn risk indicators
- Top customers by revenue
Helps improve retention and increase lifetime value.
Marketing Insights
Measure the real performance of your marketing efforts.
- AOV trend analysis
- Orders vs revenue comparison
- Discounts trend
- Coupon usage tracking
- Best time to sell (heatmap)
- Coupon performance
- Actionable marketing insights
Know what works — and what wastes budget.
Finance & Revenue Analytics
Go beyond basic sales totals with financial intelligence.
- Net revenue volatility
- Average daily net revenue
- Top 5 products revenue share
- Top product dependency ratio
- Gross vs net (realized revenue)
- Discount pressure analysis
- Refund timing insights
- Revenue concentration
- Taxes, shipping, and refunds breakdown
- Finance-focused actionable reports
Built for store owners who want financial clarity.
Performance & Technology
- Optimized REST API endpoints
- Transient-based caching (10 minutes)
- HPOS compatible
- No external APIs
- Secure permission checks
- Lightweight and scalable
Author
Charty Custom Smart Analytics is developed and maintained by Uptixa.
Uptixa is a software development company specializing in: – WooCommerce & WordPress solutions – Custom analytics & dashboards – ERP, CRM, and business software – Scalable web applications
Website: Uptixa