用外掛程式,擴增無限可能。
運用數千種外掛程式來新增功能、使用你最喜愛的工具;所有 WordPress.com 付費方案皆可使用。
profiling
12 外掛程式
 Code Profiler - WordPress Performance Profiling and Debugging Made EasyA profiler to measure the performance of your WordPress plugins and themes.
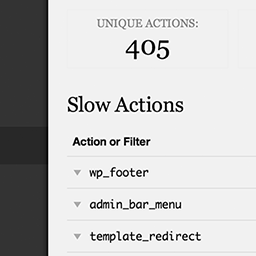 Debug Bar Slow ActionsEasily find out which actions and filters are the slowest during a page load.
 Profiling Tool For WPA plugin for testing the performance of the themes, plugins and scripts of your Wordpress site.
 DebuggerYou can use this plugin to manually log data or to capture logging on WordPress actions. You can capture load time, memory, backrace, data dumps, urls …
 Simple DebugAnalyzes WordPress website performance, helps to locate slow function hooks.
 MySQL ProfilerDisplays a list of each page's SQL queries and the functions calling them that can be searched and sorted by time, type, etc.
 WP XHProf ProfilerAdds PHP profiling support to your Wordpress using Facebook's XHProf Profiler.
 WPDB ProfilingThis plugin will give you the total number of queries to the db per page, as well as the total time it took to render those queries out to the page.
 Block Weight InspectorSee which blocks load which CSS/JS assets on a page and estimate their weight.
 HookTrace - Trace Hooks with PrecisionCross-Plugin Debug & Trace Recorder - Records and visualizes hook execution order for WordPress developers.
 What's runningLists WordPress require() calls mainly for plugin code refactoring.
 PMC BenchmarkA benchmarking plugin to profile slow hooks.