用外掛程式,擴增無限可能。
運用數千種外掛程式來新增功能、使用你最喜愛的工具;所有 WordPress.com 付費方案皆可使用。
visualization
28 外掛程式
 Visualizer: Tables and Charts Manager for WordPressA simple yet powerful WordPress chart plugin to effortlessly create and embed responsive charts & tables into your site, supporting multiple data …
 Chartify - WordPress Chart PluginChartify is a powerful WordPress Chart Builder Plugin that will help you to create WordPress Graphs & Charts easily and quickly.
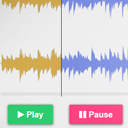 WaveSurfer-WPCustomizable HTML5 Audio controller with waveform preview (mixed or split channels), using WordPress native audio and playlist shortcode.
 UberChart - WordPress Chart PluginUberChart brings the endless customization possibilities included in the Chart.js library to WordPress.
 ThreeWPEasily integrate Three.js with WordPress to create and display 3D models and animations.
 Wizart Visualizer — AI-Powered Room VisualizationWe help thousands of home improvement retailers and manufacturers all over the globe to lower returns and sell more with Wizart visualizer.
 Internal Link VisualizerVisualize your site's internal and external links as an interactive map. Discover orphan content and optimize your linking strategy.
 WP SIMILE TimelineIntegrates the SIMILE Timeline into WordPress and provides an option interface for the various timeline settings.
 Data Diagrams: Visual Chart Editor for WordPressVisual Editor for 33+ free responsive SVG data charts - as easy as adding an image. No technical skills needed. Live data. No external API calls.
 VividWorks 3D E-Commerce ConfiguratorOnline selling like in-store selling with full 3D visual product configurator
 WallnamentVisualize your wall art from your WooCommerce shop. Plugin will help you embed the Wallnament widget
 Map VisualizerImport your data from csv files and visualise them on Google streets/satellite maps

 UVisualize!An easy to use yet powerful visualization tool for WordPress
 DH Press - Digital Humanities ToolkitDHPress is a flexible, repurposable, fully extensible digital public humanities toolkit designed for non-technical users.
 CloudstitchAdd the entire Cloudstitch library of spreadsheet-powered visualizations and widgets with just a shortcode.
 spoonacular recipe visualizerMake your recipe blog look awesome with pretty and insightful visualizations.
 Iced Visualization ChartsAllows you to insert a Google Visualisation chart by clicking button in TinyMCE and entering the data.
 Dashboard Posts StatsAdd a nice graph with your published posts during the last 30 days on a dashboard widget.
 DatapressDataPress lets you publish rich, interactive data visualizations in your blog pages and posts.
 Tally GraphAdd Google charts and graphs to your WordPress site based on tallies of any numeric custom field over time. Visualize progress toward any goal.